How the General Inquirer is
used
and a comparison of General Inquirer
with other
text-analysis procedures.
Because overlaps exist among content-analysis tools as well as with "qualitative analysis", text-management, "natural language processing" and some artificial-intelligence software, it is important to have realistic expectations about what each content-analysis tool, including the General Inquirer, can readily provide. For some research projects, especially those involving intensive analyses of modest quantities of text, other text-analysis software may be much more appropriate.
The General Inquirer is basically a mapping tool. It maps each text file with counts on dictionary-supplied categories. The currently distributed version combines the "Harvard IV-4" dictionary content-analysis categories, the "Lasswell" dictionary content-analysis categories, and five categories based on the social cognition work of Semin and Fiedler, making for 182 categories in all. Each category is a list of words and word senses. A category such as "self references" may contain only a dozen entries, mostly pronouns. Currently, the category "negative" is our largest with 2291 entries. Users can also add additional categories of any size.
In order to map category assignments with reasonable accuracy, the General Inquirer software spends most of its processing time identifying commonly used word senses. For example, it distinguishes between "race" as a contest, "race" as moving rapidly, "race" as a group of people of common descent, and "race" in the idiom "rat race". The General Inquirer also cautiously removes common regular suffixes so that one entry in a category can match several inflected word forms. A category entry can be an inflected word (for example, "swimming"), a root word ("swim" would match "swimming", if "swimming" is not a separate entry) or a word sense (for example, "swim#1") identified by our disambiguation routines of an inflected or root word form. These English stemming procedures, integrated with English dictionaries and routines for disambiguating English word senses, limit the current Inquirer system to English text applications.
Even though these disambiguation routines often require the Inquirer to make several passes through a sentence, the Inquirer is designed to process large amounts of text in a reasonable amount of time. Text files are grouped for processing into folders (compatible with input formats used by some other systems such as LIWC). The output is a matrix of "tag counts" for each category, with separate rows of counts for each file processed. Depending on the software and computer system used, as well as the length of each file, the Inquirer can assign counts for all 182 categories to text files at the rate of about a million words of text per hour. Some Inquirer projects indeed have involved analyzing several million of words of text. As with several other content-analysis systems such as LIWC, the Inquirer is especially suited for projects that draw on large amounts of text from the "information superhighway" where there are more documents being studied and/or larger amounts of text than can be coded either completely manually or with a computer-assisted manual procedure for assigning codes. The main output from the Inquirer can be displayed as an Excel spreadsheet, with both raw frequency counts and indexes scaled for document length. Statistical tests then evaluate whether there are statistically reliable differences between the texts or groupings of texts being studied.
Text-analysis tools span a wide range as to whether they just provide a vessel for manipulating text, or whether they come with content categories and language-specific routines. Those tools that are primarily text-processing vessels identify words (characters bounded by spaces or punctuation) as units and, except for problems arising from the use of special alphabets, tend to be language-independent. The Inquirer is one of the most advanced systems towards the other end of that range.
However, although the Inquirer comes with 182 categories, it is not like some content-analysis software in supplying category frequency norms. As illustrated below, the user must specify what contrasts are to be compared statistically. These might be samples of editorials from different newspapers, speeches from different political candidates, stockholder reports from different companies, etc. Whether a document is high or low in a category frequency is always relative to what contrasts are being made. However, using the same categories across research projects facilitates making such comparisons and contributes to cumulative research. Any new categories added remain readily available for others to use, especially if they are then included for distribution on this website. The five Semin and Fiedler categories are an example of such an addition.
The 182 General Inquirer categories were developed for social-science content-analysis research applications, not for text archiving, automatic text routing, automatic text classifying, or other natural-language processing objectives, although they may be relevant to some of them. People, not computers, created these categories, although some category developers drew upon cluster analyses produced by computers. Many categories were initially created to represent social-science concepts of several grand theories that were prominent at the time the system was first developed, including those of Harold Lasswell, R.F. Bales, Talcott Parsons and Charles Osgood. It also included categories relevant to "middle-range" theories, such as David McClelland's theories regarding needs for achievement, power and affiliation. With further category revisions over the years, some of these original ties to particular social-science theories are now somewhat diffused.
Creating a useful category for content analysis can be a considerable undertaking. Several tools can be help, such as a desk thesaurus. An extensive electronic lexical database such as Wordnet (developed by George Miller and colleagues at Princeton University) may also be helpful, but it can also overwhelm the category developer. An example of software that is being developed to draw upon Wordnet resources is WordStat.
Clearly specifying what a category is to represent so that everyone agrees on what entries the category should contain is not always as easy as one might think. This task is somewhat comparable to producing a set of survey questions that everyone agrees has validity in measuring a well-specified construct. Agreement may be hard to obtain. Ideally, the outcome of such a debate is a better understanding of what is being measured, as defined by a reasonably crisp set of categories.
Normally, each entry in a category is given equal weight. However, this is a choice of the category developer rather than any inherent limitation of the computer. Earlier versions of some Inquirer dictionaries included categories with weightings, but we found it difficult to obtain agreement about the weights and they added little to the validity of our counts. Currently, none of the categories employ weightings.
Special versions of the General Inquirer could also be used to develop scoring procedures that enlist multiple categories and analyze the tag patterns assigned to each sentence. This tag assignment pattern across sentences could then be used to generate an overall assessment of a document. For example, each sentence of a story could be assessed for imagery related to McClelland's "need achievement" and then the pattern of assessments across the sentences used to evaluate whether the story as a whole contained "need achievement". Another example is the use of several category assignment patterns to predict whether a suicide note is real or simulated. Such scorings procedures are illustrated in Ogilvie, D.M., Stone, P.J. and Kelly, E.F. (1982) "Computer-aided content analysis" in A Handbook of Social Science Methods edited by R. B Smith (Ballinger Press) as well as mentioned in some other Inquirer publications. For some studies, overall Inquirer codings correlated with those of expert manual coders about as well as expert coders correlated with one another. These procedures have recently been revisited by some researchers.
Researchers who study a group of documents intensively have gained additional insights by examining how the Inquirer counts can be used to map each document relative to the other documents in a corpus. Mapping tools such as "correspondence analysis" (which is used more in Europe than the U.S. and is more appropriate than factor analysis for distributions such as tag category frequencies) can help discern patterns in the data. For example when we used correspondence analysis to map the tag counts for British party manifestos over several decades, both the changing contrasts in party differences and the direction of their movement over time made interpretable sense.
Standard interfaces between disambiguated, tagged, text output as input to qualitative-analysis packages are mostly yet to be developed, mainly because of our current focus on larger databases.
Large textual data bases can often be downloaded and assembled from Lexis/Nexis, newspaper archives, government web sites, political candidate websites and many other resources available on the Internet in surprisingly short order. This can be aided by programs that gather up website texts on specified topics, such as commentaries about a product, book or film. At Harvard, Vanja Buvac has utilized such procedures to gather commentaries appearing on "epinions."
Comparison with inductive text-analysis tools
As a tool that maps pre-specified categories, the General Inquirer differs from purely inductive mapping tools, such as the so-called neural-net building procedures that are now included in several software packages. However, as the correspondence analysis example above indicates, some inductive tools may be applied to Inquirer-produced spreadsheets of category counts, mapping either the relationships between categories or the relationships between documents into a multidimensional space.
One useful comparison is between the General Inquirer and SPSS's TextSmart , an inductive clustering tool primarily designed for open-ended survey answers. In addition to providing completely inductive automatic clustering, TextSmart also gives its users an option to supply categories of words that are to be treated as synonyms in the clustering process. However, categories are not provided nor does TextSmart attempt to identify word senses.
TextSmart is relatively new and we have yet to see many publications based upon its clustering procedures. In contrast, correspondence analysis, has been applied to various raw text applications, with a book by Lebart and colleagues (Exploring Textual Data, Kluwer, 1997) devoted to reporting them. Many additional applications can be found by doing a "Google" on "correspondence analysis."
A very different inductive approach is "Latent Semantic Analysis", developed by Thomas Landauer and his colleagues at the University of Colorado. Their procedures are described fully at http://lsa.colorado.edu .
Fortunately, there need not be an either-or choice between one approach and another. Once text is collected to be processed on computers, it can be processed by different software, or combinations of software, at little additional cost.
Comparison with artificial intelligence and natural-language processing tools
Unlike some artificial intelligence programs that can be applied to texts within limited topic domains, the General Inquirer simply maps text according to categories and does not search after meaning. General Inquirer mappings have proven to supply useful information about a wide variety of texts. But it remains up to the researchers, not the computer, to create knowledge and insight from this mapped information, usually situating it in the context of additional information about the texts' origins.
A book by Charles Jonscher, (The Evolution of Wired Life, Wiley Press, 1999) argues that younger adults, having been using computers since they were children, tend to be more realistically sage in their expectations of what computers do well. He says they recognize that mapping functions (even those offered by simple spreadsheet tools) can have considerable value, but that they do not assume such mappings in themselves constitute knowledge or wisdom. Our experience from teaching content analysis over several decades tends to confirm Jonscher's observations. Much confusion existed in the early days of large main-frame computers between content-analysis of text and understanding text. Programs such as Weizenbaum's "Eliza" that pretended to be a psychotherapist only added, to Weizenbaum's surprise, to the confusion. We hope that era is behind us and we can get on with our research.
Artificial intelligence tools, natural-language processing tools, and content-analysis tools such the General Inquirer should not be expected to generate "meaning" in either the sense of an ordinary listener's comprehension or that of a specialist such as a linguist, psychoanalyst, or cultural anthropologist. That acknowledged, researchers may also want to consider what different insights AI and NLP programs offer. The General Inquirer already provides for each document one rudimentary NLP index, namely the document's mean word length. Such a simple index, in fact, often discriminates between sources, reflecting consistent preferences for shorter or longer words. Various other indexes offered by natural language processing software, much of it available on the Internet, could also be enlisted, as described in Manning and Schutze's Foundations of Statistical Natural Language Processing (MIT Press, 1999). Such indexes could be incorporated into a discriminate function analysis, or they perhaps also could be fed into a neural-net program, such as Clementine, to learn to distinguish groups of texts.
As more textual information is gathered over the internet, we can expect more use of resources both from artificial intelligence and natural language processing as well as content-analysis procedures to analyze patterns in such texts, including software that provides fairly elaborate analyses of grammar. One application already in extensive development, for example, is the utilization of computers to analyze GMAT essays written by applicants to business schools.
Websites comparing text-analysis software
Fortunately, content analysis, qualitative analysis, and text management software packages are compared on several websites. We find these two web sites to be especially useful overviews:
http://www.intext.de/TEXTANAE.HTM
This German site has been reorganized following the June 2000 International Communications meetings that featured workshops on content analysis. Describes content analysis tools targeted to different languages, as well as lists of software for natural language processing. Content-analysis software is listed according to whether or not it is dictionary based. Also discusses some of the more frequently used category systems.
http://www.gsu.edu/~wwwcom/content.html
This Georgia State University web site also very useful and is frequently updated with references to articles about content analysis.
Inasmuch as the Inquirer is not commercially marketed, we recommend that researchers who have not taken a seminar or workshop on the General Inquirer try using commercially available content-analysis tools before contacting us about using the Inquirer. One of the few dictionary-based content-analysis tools to include a form of word sense disambiguation, developed by CL Research, is cited as MCAA on the German site and as DIMAP on the Georgia State site. That software could especially useful if your research question can be cast in terms of scores on their four dimensions.
Comparison with qualitative-analysis and text-management tools.
Qualitative-analysis tools generally are especially designed for organizing textual information. They have been found especially useful, for example, for organizing field notes. These text-management tools search, locate and count instances of specified occurrences in texts. Generalizations about these tools become difficult because of overlap in what various software packages provide. While many of them provide for user-supplied word categories, none of them, to our knowledge, provide any word-sense identification procedures or an extensive set of preexisting categories comparable to the General Inquirer.
Many of these tools are better geared to identifying topics in contrast to the treatment of topics. A tool may quickly locate, for example, those documents. that are concerned with "training and education". They are less well suited to evaluate, for example, the document's overall level of positivity, use of understatement, or emphasis on virtues.
Going to the qualitative research sites and then downloading their demo programs can be helpful. In our own explorations using some of these sites, we have found the German Atlas/ti, the Australian Nud*ist (also called QSR) and the American HyperResearch, to be outstanding, especially for the organization of field or observation notes. WinMax, we are told, has become especially popular in Europe.
For more straightforward text management software that includes options to create lists of equivalence words, we particularly recommend another Australian system, ISYS
We recommend that students investigate and compare these different tools through their web sites. Having a good idea of what the different systems offer can be helpful in mapping an effective research strategy
What statistics are used in General Inquirer research?
Unlike some dictionary-based content analysis approaches such as that offered by CL Research, the General Inquirer does not provide norms. If about a tenth of the words in a document were scored as positive, we would say from our experience that is quite a lot. Also, we generally expect there to be more positive than negative words. However, we do not have a norm that says 5.7% of the words are expected to be positive or that the expect ratio between positive to negative words is 1.83. We have not been comfortable about what such norms, based on a corpus of supposedly neutral texts, really signify, especially when inferences are drawn based upon very small differences from these norms.
Instead, General Inquirer research is comparative between the cases studied within a research project. The General Inquirer output spreadsheet usually has such identifiers in the first columns, taken from the file names that were created when preparing data.
Most of the statistics used in General Inquirer research involve simple one-way analysis of variance. This can be carried out in Excel (especially with its statistical "add-in" implemented), SPSS or JMP, as well as other spreadsheet-based software. The charts below were prepared using JMP, which offers several advantages, including grouping by text categories (rather than only by numbered categories, as with SPSS) and providing the between-group comparison displays shown below. It has a student-priced edition, which also includes correspondence analysis, that runs on both PC's and Macs.
These analyses of variance evaluate whether the between-group variance is significantly greater than the within-group variance using scores scaled for document length. The first step therefore is to define groups of documents so there are multiple documents within each group. The within-group variance will generally be less if each document is based upon a reasonable amount of text and there are more documents in a group. The within-group variance is also reduced if the cases in each group are less variegated. In the examples below, between-group differences held up even though the cases within each group spanned different topic areas.
The two charts below are typical examples of one-way ANOVA comparisons. They show the percent of positive words and the percent of negative words for the campaign-related speeches of each of the five American presidential candidates (in the presidential primaries as of December, 1999), as gleaned from their web sites. As can be seen in the F statistics, the between-candidate mean differences, relative to the within-candidate variances, are significant in both tables at the .0001 level.
The dots for each candidate show the spread of scores for his speeches. The width of each diamond shows that candidate's proportion of the total data, with Gore and McCain having respectively 55 and 39 speeches, considerably more than the others. The height of each diamond indicates a 95% confidence interval. If two diamonds do not overlap, such as those of McCain and Bradley on both charts, they are considered significantly different. The charts show McCain is higher on the use of both positive and negative words than, for example, Gore. Bradley is low in the use of either positive or negative words. Bush has positive words dominating over negative ones, while Buchanan is more negative than positive.
…
% Positive Words By Candidate
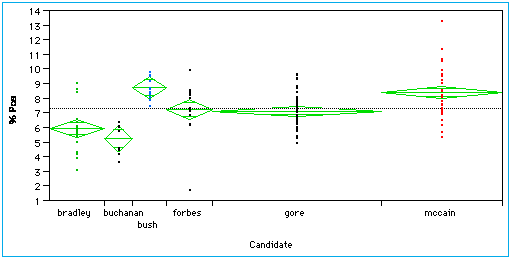
Analysis of Variance
Source DF Sum
of Squares Mean Square F Ratio
Model 5 142.02875 28.4058 15.2455
Error 141 262.71392 1.8632 Prob>F
C
Total 146 404.74267 2.7722 <.0001
Means for Oneway Anova
Level Number Mean Std Error
bradley 18 5.93667 0.32173
buchanan 9 5.31222 0.45500
bush 11 8.74455 0.41156
forbes 15 7.25600 0.35244
gore 55 7.14582 0.18406
mccain 39 8.42282 0.21857
% Negative Words By
Candidate…
…
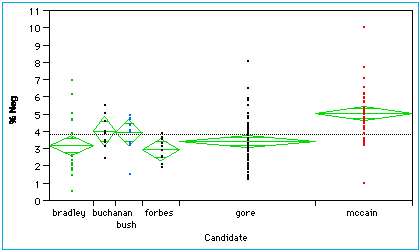
Oneway Anova
Analysis of Variance
Source DF Sum of Squares Mean Square F Ratio
Model 5 84.78421 16.9568 9.2348
Error 141 258.90143 1.8362 Prob>F
C
Total 146 343.68564 2.3540 <.0001
Means for Oneway Anova
Level Number Mean Std Error
bradley 18 3.21389 0.31939
buchanan 9 4.01333 0.45169
bush 11 3.94636 0.40857
forbes 15 3.00533 0.34987
gore 55 3.45145 0.18272
mccain 39 5.06769 0.21698